Stop Guessing. Start Trading With70 Years of Market Data Behind Every Signal.
Our AI engine scans 3,000+ stocks daily across the S&P 500, NASDAQ, and Russell 2000 — combining multi-layer seasonality, relative strength, volume analysis, and momentum scoring to surface the 10-15 highest-conviction trade setups. So you spend 15 minutes instead of 3 hours finding your next winner.
The Numbers Don't Lie
A decade of live trading results. Not theory. Not backtests on cherry-picked data. Real performance.
Market Coverage Worldwide
Scanning and analyzing equities across the world's leading exchanges

Four Dimensions of Edge — Working Together
Most traders use one indicator. We use four — simultaneously — and only surface stocks that score high across ALL of them.
Got questions?
Everything you need to know about Signal Season and our AI-powered signal platform.
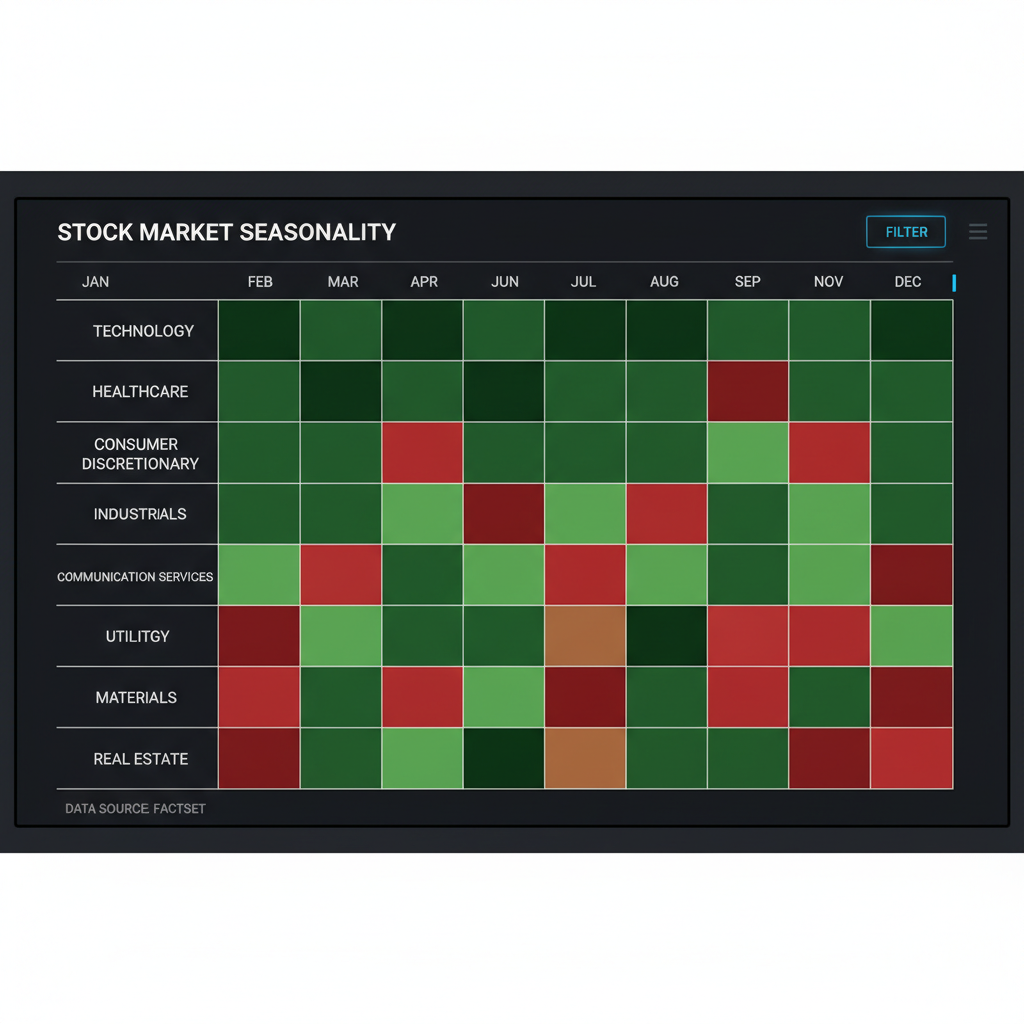
We analyze 70+ years of daily market returns across 4 distinct layers — overall market seasonality going back to 1950, sector-level patterns since 1993, 104 industry groups with a 14-year lookback, and individual stock patterns. The result: you know exactly which months, weeks, and even days historically favor specific sectors and stocks. This isn't astrology — it's statistical probability derived from decades of price data.
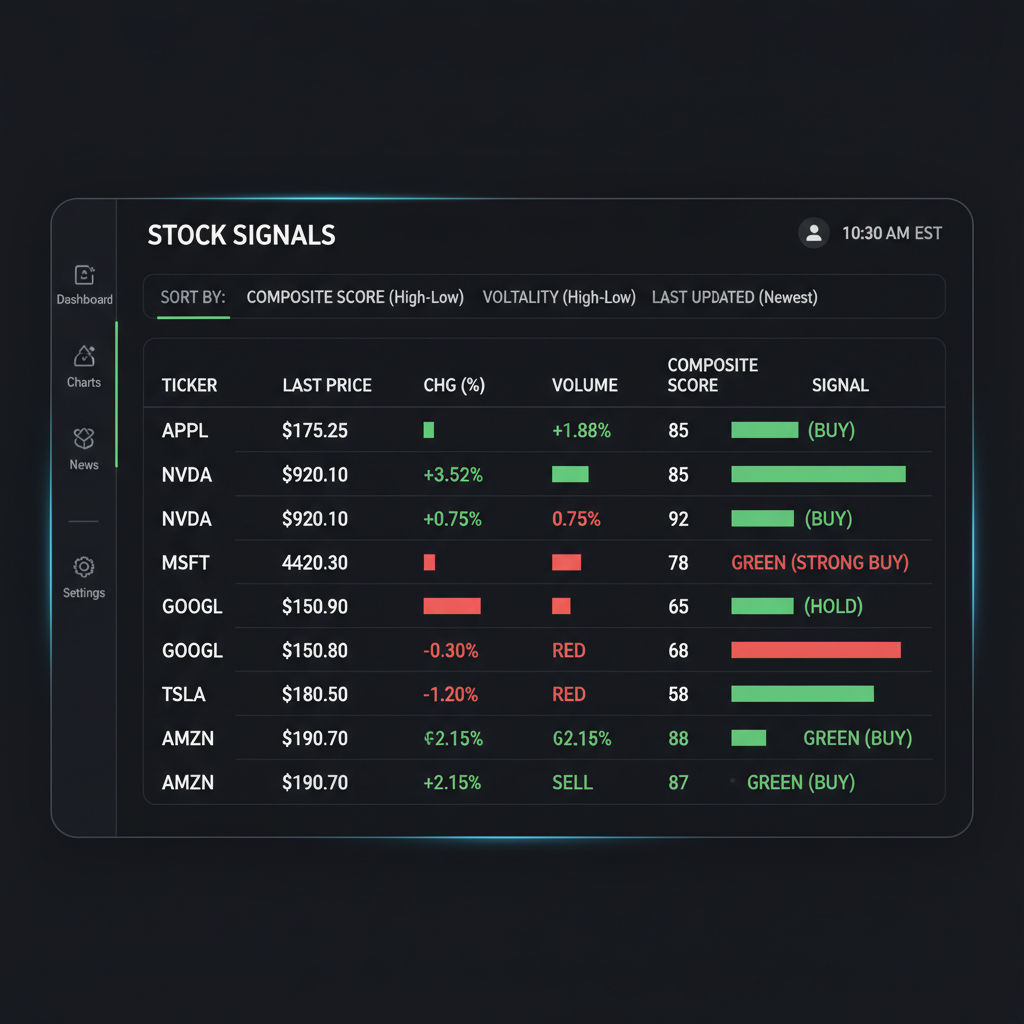
Every trading day we scan approximately 3,000 stocks across the S&P 500, NASDAQ, and Russell 2000. Each stock is scored on four dimensions — relative strength vs. benchmark, volume accumulation patterns, PPO momentum crossovers, and multi-layer seasonality. Only the stocks scoring high across ALL four dimensions make the final cut. You get 10-15 setups, not 500.
The methodology behind Signal Season has delivered 30-40% annual returns over a decade of live trading — not hypothetical backtests, but real positions. That said, past performance doesn't guarantee future results, and no system is right 100% of the time. What our composite scoring does is stack the odds heavily in your favor by requiring confirmation across multiple independent indicators before surfacing a signal.
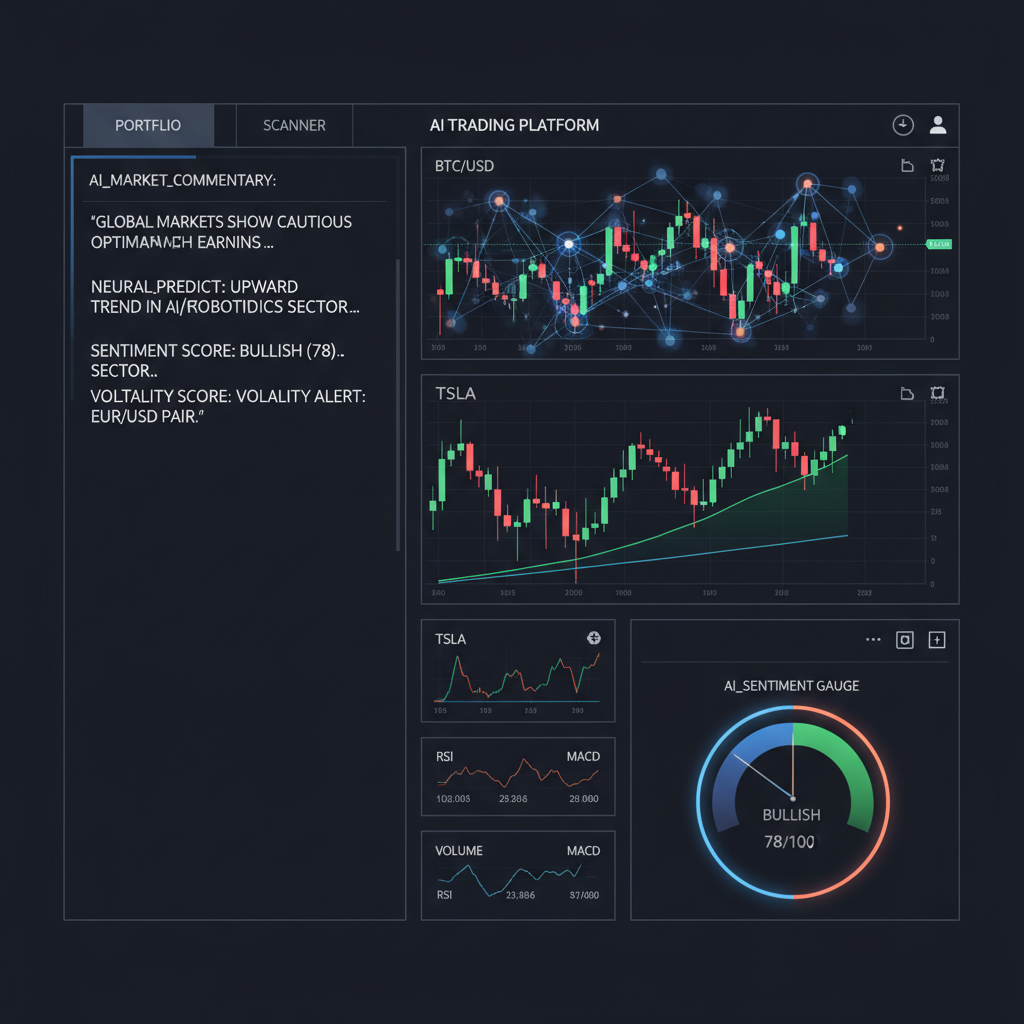
No. Signal Season is an educational and informational platform. We surface data-driven signals and provide AI-generated analysis explaining why each signal triggered. All trading decisions are 100% yours. We strongly recommend consulting a qualified financial advisor before making any investment decisions.
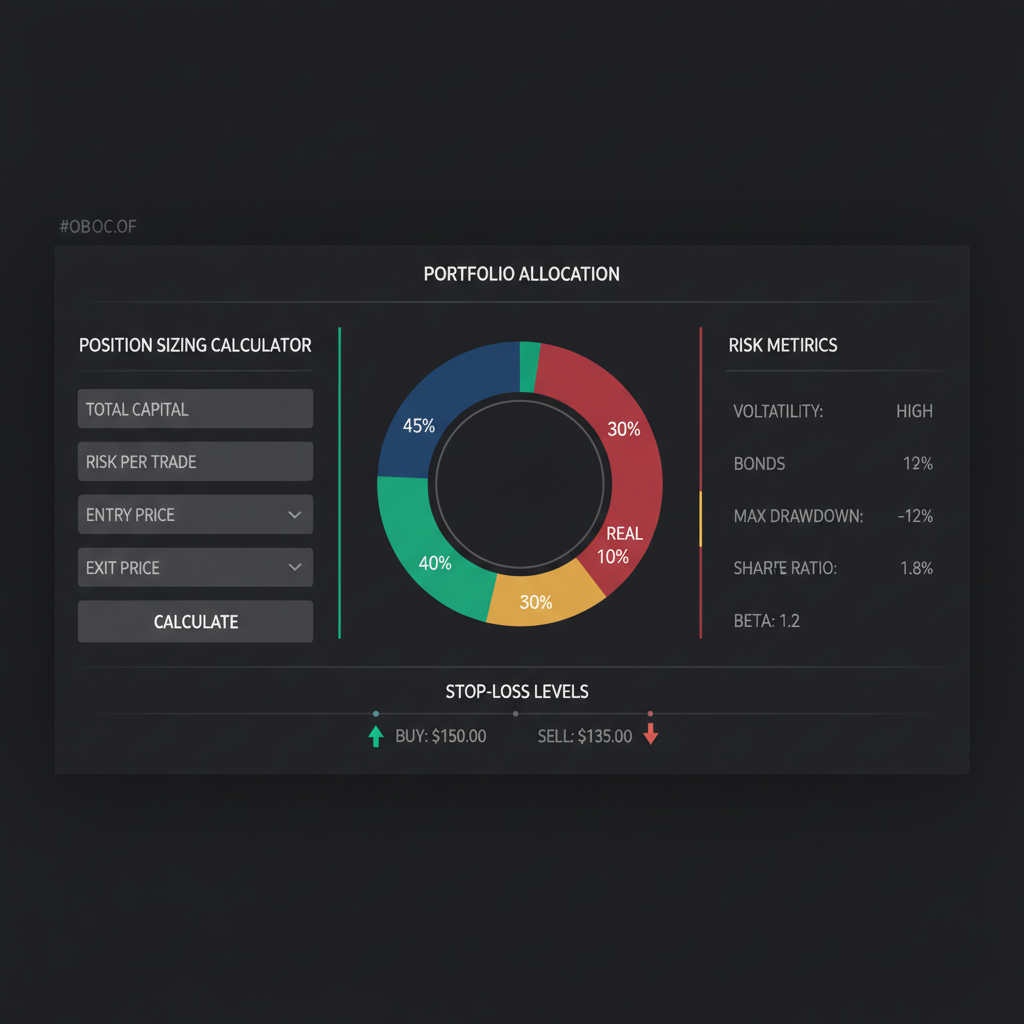
Early access members ($50-99/mo) get everything: the full signal screener with daily end-of-day scans, the 4-layer seasonality explorer, custom watchlist management, AI-powered trade analysis for every signal, and the risk calculator. This is the same platform that will be $300-400/mo at general launch. Early access members lock in their introductory rate for life.
We're building Alpaca integration for paper trading so you can test signals risk-free. Live brokerage execution is on the roadmap. For now, signals are displayed in your dashboard with exact entry points, stop-losses, and position sizes — you execute through your preferred broker in under 60 seconds.
The Market Rewards Preparation. Not Guesswork.
Join 100+ early access traders getting AI-powered signals backed by 70 years of market data. Starting at $50/month.
Limited to first 100 members at introductory pricing. No long-term commitment.